IPP Demosites

By the Numbers

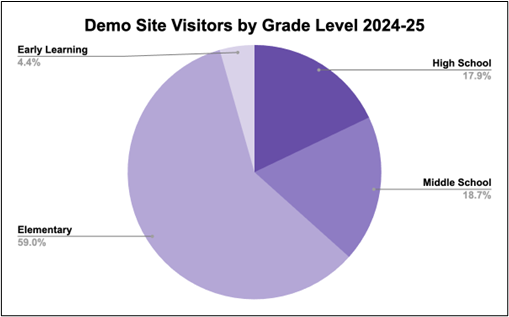
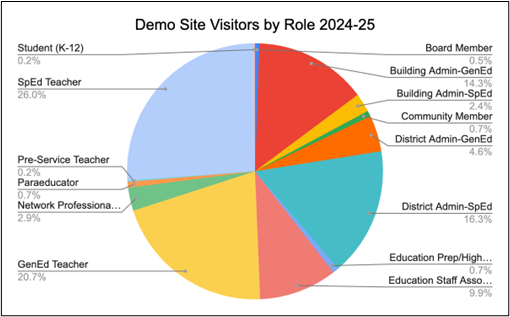
As part of our Demonstration Sites Work, we are examining who is participating in the IPP Demonstration Sites Professional Development and where they are participating from. This gives us some valuable information of our impact and reach, in addition to regions where we might need to do some additional partnering and outreach. One of the goals of the IPP Demo Sites Project is to provide transformational professional development to visiting schools that results in schools across Washington implementing inclusionary practices.  Data from visiting schools  allows us to be responsive and to collect information from attendees to see how IPP Demonstration Sites are impacting visiting schools through 3-month implementation fidelity checks. It also provides information about regions that are not accessing our professional development so we can discover more effective ways to engage with these communities.

  • Individuals Represented in ESDs – This map represents the number of individual registrants from each ESD that participated in the IPP Demonstration Site webinars hosted in Spring 2020. Registrants represented each of the ESDs in Washington State with the greatest number of individual attendees from ESD 121, 189, 105, and 101.
  • School Districts Represented in ESDs – This map shows the number of school districts from each ESD that participated in the IPP Demonstration Site webinars hosted in Spring 2020. School districts from all nine the ESDs in Washington State were present with the greatest number of school districts from ESD 121, 189, 105, and 101.
  • Percentages of School Districts Represented in ESDs – This map depicts the percentage of school districts in each ESD that participated in the IPP Demonstration Site webinars hosted in Spring 2020. The following ESDs had more than one third of their school districts represented: ESD 121, ESD 105, ESD 114, ESD 123, ESD 171 and ESD 189.